
Pokemon Card Arbitrage: Real Gaps vs Illusions
TCGPlayer market tops the PriceCharting blend on almost every card. We pulled five live grids to separate real cross-market arbitrage from condition mirages.

Pull up any single in two tabs. Put the TCGPlayer market price in one and the PriceCharting blended price in the other. Almost every time, TCGPlayer reads higher. The instinct that follows is the one that gets new flippers in trouble: buy where it is cheap, sell where it is dear, pocket the spread. That is the textbook definition of arbitrage, and on paper the gap looks like free money sitting on the table all day.
It usually is not. We pulled five live grids this morning, June 29, 2026, across a price range from $52 to over $2,200, to show exactly how wide that gap runs and, more importantly, why most of it is an illusion you cannot actually cash.
The data: five cards, two markets, one morning
Every number below was pulled June 29, 2026. The TCGPlayer figure is the holofoil market price from the Pokemon TCG API. The PriceCharting figure is its blended ungraded price, which folds in recent eBay and marketplace sold listings.
| Card (set, number) | TCGPlayer market | PriceCharting ungraded | Apparent gap |
|---|---|---|---|
| Umbreon VMAX (Evolving Skies #215) | $2,210.46 | $2,044.29 | +$166 (8%) |
| Pikachu ex (Surging Sparks #238) | $382.02 | $295.00 | +$87 (30%) |
| Dragapult ex (Prismatic Evolutions #165) | $133.49 | $113.05 | +$20 (18%) |
| Gardevoir ex (Scarlet & Violet #245) | $87.78 | $76.99 | +$11 (14%) |
| N's Zoroark ex (Journey Together #185) | $52.39 | $44.61 | +$8 (17%) |
Read down the gap column and the pattern is loud. TCGPlayer wins every row, and the percentage gap on the mid-tier cards is fat. Pikachu ex shows a 30% spread. If that were a true cross-market price difference for the same card in the same condition, you could buy a copy off the PriceCharting comp, list it on TCGPlayer, and clear close to ninety dollars before fees on one card. Nobody leaves a 30% arb open on a liquid card. So what is actually happening here.
Why the gap is mostly a condition illusion
The two numbers are not measuring the same thing, and that is the whole story.
TCGPlayer's holofoil market price is built from listings and sales of the foil version in roughly near-mint shape, because that is what the bulk of the platform's sellers grade their cards as and what buyers default to. PriceCharting's blended ungraded number is a different animal. It folds in eBay and marketplace solds, and that pool includes lightly played copies, edge-whitened copies, and the occasional creased one a seller dumped at a discount. The blend is dragged down by every below-near-mint sale in the window.
So the gap you are reading is not "TCGPlayer is overpriced." It is "TCGPlayer is quoting near-mint and PriceCharting is averaging in damage." The bigger the surface-condition variance on a card, the bigger the fake gap. That is exactly why Pikachu ex #238 shows the widest spread in the table. It is a textured Special Illustration Rare, the kind where edge wear and print lines are common, so the ungraded sold pool is full of off-condition copies that pull the blend well under the clean-copy price. Condition is the entire engine here, and it is the same force that decides whether a grade adds money or destroys it: the market pays for the top of the condition curve and quietly discounts everything below it.
Moonbreon shows the inverse. The gap there is only 8%, the smallest in the table, because a $2,200 card gets handled carefully, sleeved early, and sold near-mint far more often. Less condition variance, smaller fake gap. The spread shrinks as the cards get more expensive precisely because expensive cards live in better condition.
Where the arbitrage is actually real
None of this means cross-market gaps never exist. They do. They are just narrower than the table makes them look, and they live in specific places.
The first is genuine same-condition price differences between platforms. A clean near-mint copy really can sell for a few dollars more on one marketplace than another on a given day, because each platform has its own buyer pool and its own momentary supply. That gap is real, but it is small, often 5% to 10%, and it moves daily.
The second is the one a tool actually helps with: a single mispriced listing. Someone lists a near-mint Gardevoir ex at $62 when the market is $88, because they keyed the wrong number or just want it gone. That is a real $26 edge on one copy, and it is gone in minutes. Catching it is the entire job of Flipr's QuickFlip scanner, which watches for listings that sit below the live market rather than chasing the phantom gap between two differently-built average prices.
The thing to understand is that the real edge is per-listing and time-sensitive, not a standing spread you can harvest off a price chart. The chart gap is a measurement artifact. The listing gap is the opportunity.
Then fees eat what is left
Say you find a genuine same-condition gap. Now run it through the part of the math everyone skips at the buy button. Once you add the marketplace cut and shipping, you are giving back somewhere in the range of 10% to 15% of the sale price before a dollar of profit shows up, and the exact number depends heavily on which venue you sell through.
Put that against the table. The N's Zoroark gap is $8 on a $52 card. A clean cross-market spread on a card like that, after a roughly 13% sell-side haircut, is underwater before you account for your buy-side shipping. The Dragapult gap is $20 on a $133 card, and a 13% fee on the sale is about $17. The apparent edge and the cost of capturing it are nearly the same number. This is the trap: the gap that looks like profit on the chart is usually just the fee you are about to pay, wearing a disguise.
It gets worse when you factor time. A thin arb that nets a few dollars still ties your money up for the days or weeks it takes to sell, which is why profit per day beats profit per card as the metric that actually tells you whether a flip was worth doing. A five-dollar spread that locks up capital for three weeks is a worse use of money than leaving it in your buy fund.
The takeaway
Stop trading the gap between two average prices. It is built from different condition assumptions and it pays the fee, not you. The cross-market spread on a price chart is a measurement artifact about 80% of the time, and the fatter it looks, the more likely it is just a card with high condition variance.
The real arbitrage is a specific clean copy listed below its real near-mint market, captured fast, on a card liquid enough to flip before the edge decays. Everything else is the chart lying to you in a way that happens to flatter your worst instinct. Pull the live numbers, separate condition from price, subtract the fee first, and most of the free money on the table turns out to belong to the marketplace.
Want to flip smarter, not harder?
Flipr's free toolkit surfaces the most profitable cards to grade and the spreads to arbitrage, refreshed every 30 minutes. Twelve tools, zero subscriptions.
Open FliprMore on PSA flipping
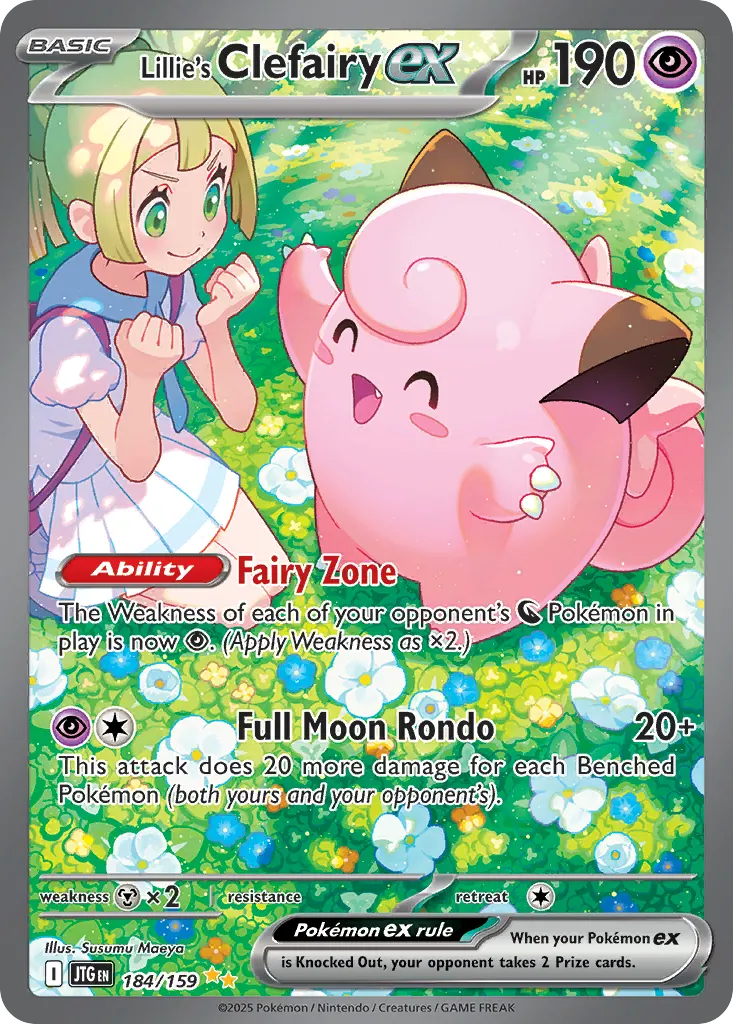
PSA 10 Pokemon Card Prices Are Dropping Faster Than Raw Cards
We re-checked eight cards we covered since May. Raw prices fell about 14%, PSA 10 prices fell about 19%, and the reward for grading shrank on six of the eight.
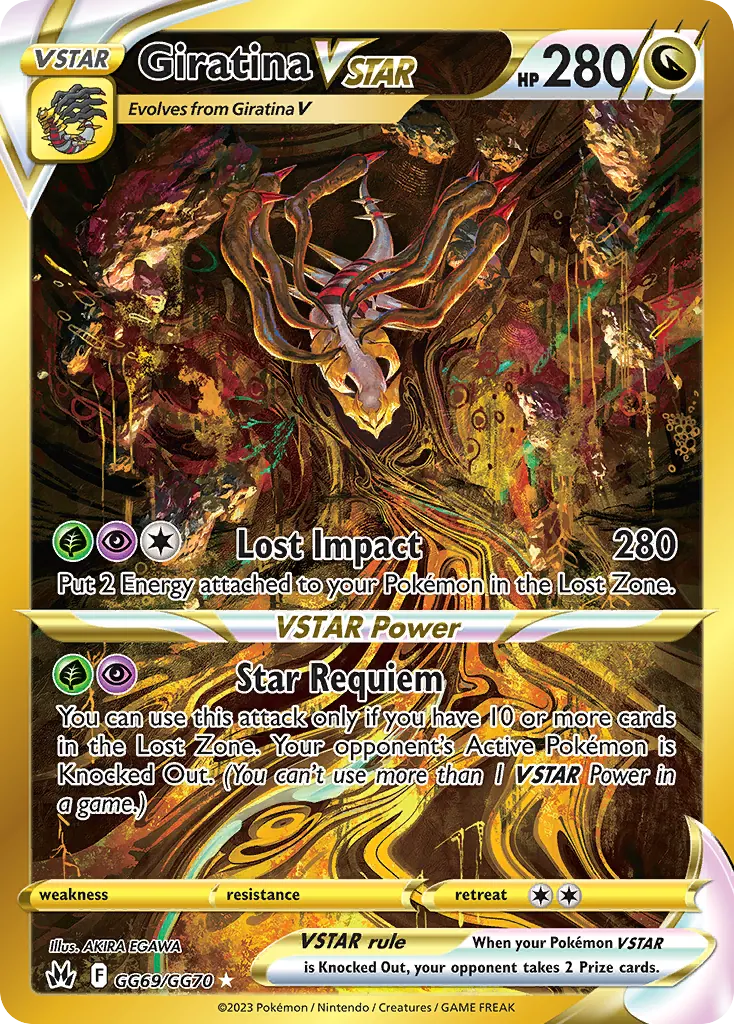
Buy the PSA 10 or Grade Your Own? The $79.99 Math
PSA paused its Value tiers, so grading now starts at $79.99. We ran the break-even gem rate on seven live price grids to find when buying the slab wins.
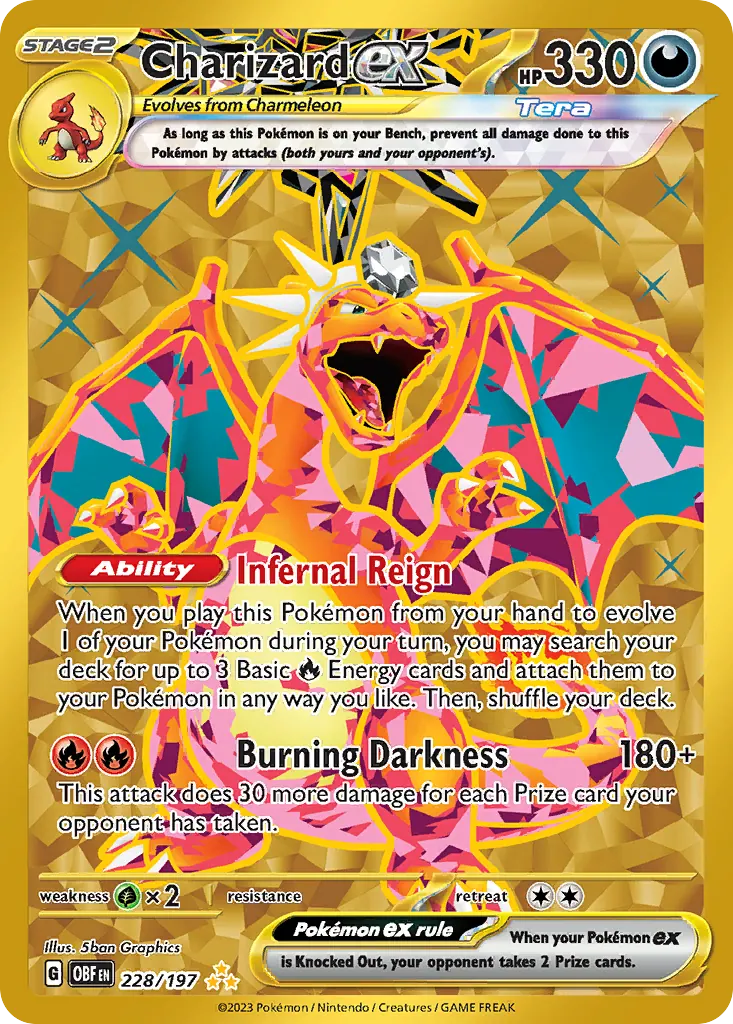
Japanese vs English Pokemon Cards: The Grading Math
Japanese cards grade higher. That does not make them the better flip. We pulled four live grade ladders in both languages and ran the actual profit math.