
How to Read PSA's Pop Report Like a Pokemon Flipper
PSA's pop report is the most underused free tool in Pokemon flipping. Here's how to read it for gem rates, scarcity signals, and pop-driven plays.
Most Pokemon flippers obsess over price guides and never open the pop report. That's backwards. The price guide tells you what a card sold for. The pop report tells you the things that actually predict whether your submission will pay off: how often a graded card actually hits PSA 10, how scarce the surrounding grades are, and whether the population is growing fast enough to compress prices in the next quarter. The price comes from those numbers, not the other way around.
This guide walks through the three numbers in the pop report that matter, three real worked examples pulled today from live data, and the kinds of plays you can run once you can read the report fluently.
What the pop report actually is
PSA's population report is a public free database at psacard.com/pop that lists every PSA-certified card and the count at each grade from 1 through 10. CGC and BGS keep their own equivalents. PriceCharting and a few specialty sites (Gemrate, PokeMetrics) republish a combined PSA-plus-CGC view and add charts, which is usually a faster way to scan the data than PSA's own UI.
The reports update on a rolling cadence (PSA pushes weekly batches; the third-party mirrors pull from there). They never miss a card because the data is the grading service's own ledger. They do lag the absolute current number by a few days, which only matters if you're trying to time a fresh release window. For everything else, the pop report is the ground truth.
The three numbers that matter
Most flippers stop at one number: the PSA 10 count. That's where the trouble starts.
Three numbers actually drive your decision:
- Total population. How many copies of this card have been graded across all grades. Scarcity at the card level.
- PSA 10 count. How many gem-mint copies exist in graded form. Ceiling supply for the PSA 10 market.
- Gem rate, also called the 10-rate. PSA 10 count divided by PSA total. The probability you'd assign to a clean copy hitting 10 if you shipped it today. This is the number that decides whether a submission is EV-positive before you even check the price gap.
Two cards can both have, say, ten thousand PSA 10s, and one is a fine flip while the other is a money loser. The gem rate is what separates them. A card with 10,000 PSA 10s and a 70% 10-rate has a different submission story than a card with 10,000 PSA 10s and a 30% 10-rate, even at the same headline price.
Worked example 1: high gem rate, modest premium
| Mega Lucario ex SIR (Mega Evolution #179) | Count | $ |
|---|---|---|
| PSA 7 | 47 | $115.50 |
| PSA 8 | 339 | $148.07 |
| PSA 9 | 2,643 | $225.75 |
| PSA 10 | 6,018 | $537.79 |
| PSA total | 9,103 |
Live PriceCharting pop pull on May 31, 2026. The gem rate here is 6,018 divided by 9,103, which works out to 66.1%. Two out of every three Mega Lucario ex SIRs that PSA has graded hit 10.
That number changes the math completely. The PSA 9 at $225 nearly matches the ungraded ($202), so a 9 is roughly break-even minus the $25 grading fee, call it a $20 to $30 loss after eBay's cut. The 10 at $537 is the entire prize. With a 66% hit rate you'd expect (0.66 × $537) + (0.34 × $225) = $431 gross per submission, before fees. After a $25 grading fee and a 13% eBay take you net around $350, against a $202 buy. That's $148 of expected profit per card, which is a healthy submission.
Important caveat: the population's gem rate is the rate across the cards people chose to submit, not across all copies in existence. Submitters already pre-grade and self-select. So the 66% number is the rate among reasonably clean copies that someone thought were worth shipping. If your copy is visibly worn, your real odds are lower than what the public number suggests. For the centering and corner pre-grade you'd do before sending anything, the question is whether you're closer to a typical submitter or below them.
Worked example 2: tough gem rate, big premium
| Pikachu ex 238 SIR (Surging Sparks) | Count | $ |
|---|---|---|
| PSA 8 | 2,821 | $271.99 |
| PSA 9 | 13,453 | $325.00 |
| PSA 10 | 8,485 | $1,132.22 |
| PSA total | 25,229 |
Same date, same source. Different story. The gem rate is 8,485 divided by 25,229, which is 33.6%. Roughly one in three submissions hit 10.
The Pikachu ex 238 PSA 10 premium is 3.5x the PSA 9 number ($1,132 vs $325), and as we covered in the PSA 9 tax post, the 9 here is actually a loss after fees against the raw card cost. So the whole bet is the 10, and the 10 hits one third of the time. Run the same EV math: (0.336 × $1,132) + (0.664 × $325) = $596 gross. Minus 13% eBay fee, minus $25 grading, minus a ~$322 raw cost, you net about $172 of expected profit per submission.
That's still positive, but it's much higher variance than the Mega Lucario flip. With a 33% hit rate you're absorbing two losing submissions for every winner. A small sample of three or four cards can come back zero PSA 10s and put you underwater on that batch. The pop report told you that. The price guide alone didn't.
Worked example 3: high gem rate, big absolute dollars
| Umbreon VMAX 215 alt art (Evolving Skies) | Count | $ |
|---|---|---|
| PSA 8 | 1,508 | $1,785.50 |
| PSA 9 | 6,104 | $2,294.47 |
| PSA 10 | 20,819 | $4,356.00 |
| PSA total | 29,737 |
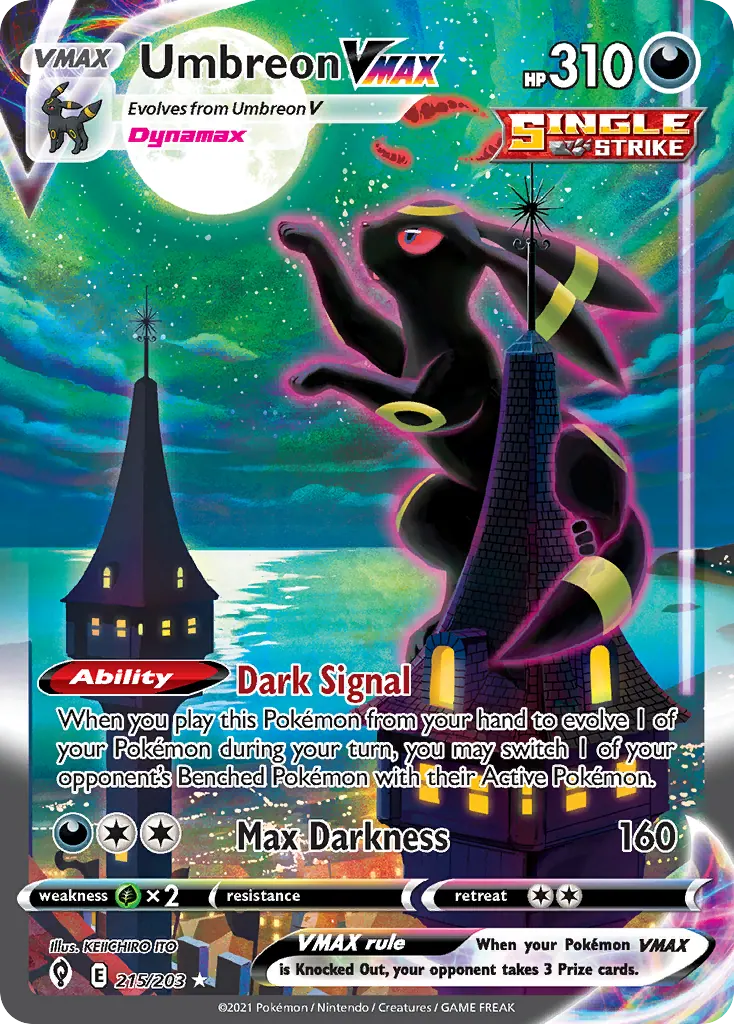
This is what a well-aged alt art looks like in the pop data four-plus years after release. Gem rate: 20,819 divided by 29,737, or 70.0%. Seven out of ten Umbreon VMAX 215 submissions hit 10.
The PSA 10 premium over PSA 9 is "only" 1.9x ($4,356 vs $2,294). Smaller multiple, but a much bigger absolute dollar floor. A 9 is still about $2,000 of value before fees. Expected gross per submission is (0.70 × $4,356) + (0.30 × $2,294) = $3,737. After fees and grading, against a ~$1,986 raw, you're looking at roughly $1,250 of expected profit per card.
This is a different kind of flip. The capital lock is brutal because you're laying out $2,000 to play, but the variance is low and the expected gain is large in absolute terms. Hot, brand-popular alt arts from older sets often look like this in the pop report: gem rates above 60%, modest 9-to-10 multiples, and an asymmetric profit floor that makes them feel boring right up until they print money.
Pop-driven plays you can actually run
Once you can read the report fluently, three plays open up:
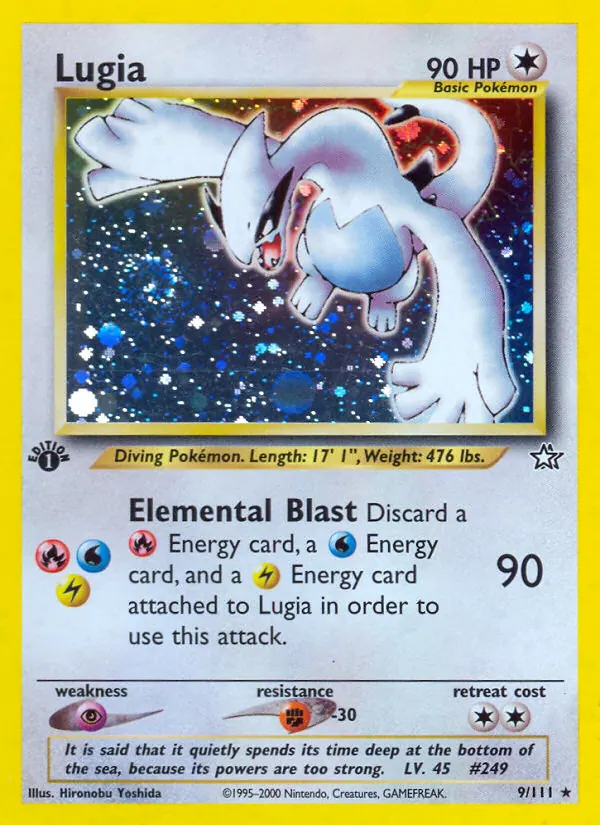
Low-pop scarcity hunting. Filter for cards with PSA 10 counts under 100 and rising demand. Neo Genesis 1st Edition Lugia is the textbook version of this: a card with deep brand recognition and a PSA 10 population small enough that every sale is a real signal, not noise. The opposite of the Umbreon VMAX situation, where 20,000-plus PSA 10s means most comps are noise.
Pop trajectory, not just absolute pop. A card whose PSA 10 count doubled in the last 90 days is about to face price compression. Doesn't matter that the headline count is small if it's growing fast. Track month over month, not just the snapshot.
Inverse trajectory. A card whose pop hasn't moved in six months and whose price is creeping up is in an undersupply, not a fad. Those are the safer holds.
The other reason to read the report regularly: it tells you when choosing PSA vs CGC vs BGS actually matters. For cards where the gem rate is high and the premium is modest, CGC's cheaper fee and faster turnaround often clears more dollars per slab. For cards where the PSA 10 premium is genuinely 3x the 9, PSA's brand premium pays for itself. The pop report shows you which bucket each card falls into.
The video below from BulbaSquad walks through the report UI itself if you want a live demonstration of pulling these numbers:
The one action to take this week
Pick one card you actually own. Pull its pop report (PriceCharting's pop page or psacard.com/pop will both work). Compute the gem rate. Now run the numbers through Flipr's profit calculator using PSA 9 and PSA 10 values from the same date, with the gem rate as your hit-probability input. Most flippers do this exercise once and realize their portfolio is heavier on low-gem-rate cards than they thought. Some of those are still positive EV. Some are not. The pop report is the only number that tells you which is which.
Want to flip smarter, not harder?
Flipr's free toolkit surfaces the most profitable cards to grade and the spreads to arbitrage, refreshed every 30 minutes. Twelve tools, zero subscriptions.
Open FliprMore on PSA flipping

How to Tell If a Card Will PSA 10 Before You Send It
Four physical checks that predict PSA 10 grades with 80%+ accuracy: centering, edges, corners, surface. Plus how to spot the dealbreakers under your phone's flashlight.
The PSA 9 Tax: What Missing a 10 Really Costs
We pulled live PSA 9 and PSA 10 prices across four card tiers. The gap swings from under 2x to over 13x, and modern chase cards hide a brutal PSA 9 trap.
PSA vs CGC vs BGS in 2026: Which Grader Actually Maximizes Your Resale?
Side-by-side breakdown of PSA, CGC, and BGS for Pokémon flippers. Turnaround, fees, market premium, and which grader actually moves the needle on resale.